Financial information
Financial indicators (graphs)
2023 dates from April 1, 2023 to March 31, 2024
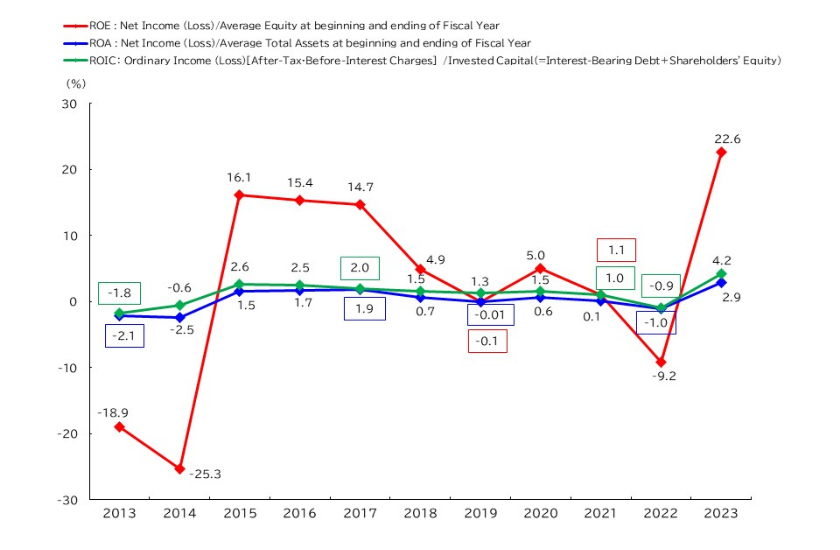
ROA, ROE, ROIC
(Consolidated)
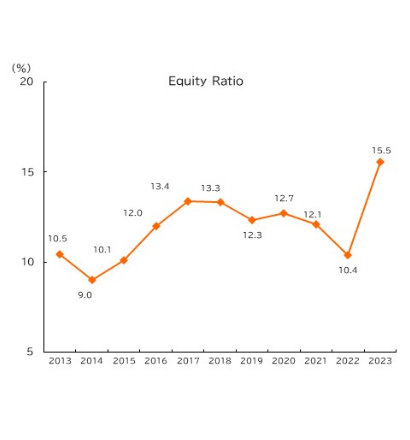
Equity ratio
(Consolidated)
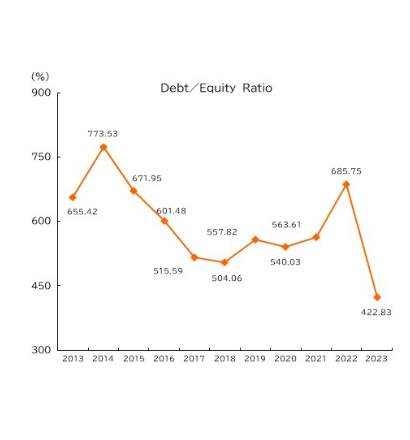
Debt/equity ratio
(Consolidated)
EPS
(Consolidated)
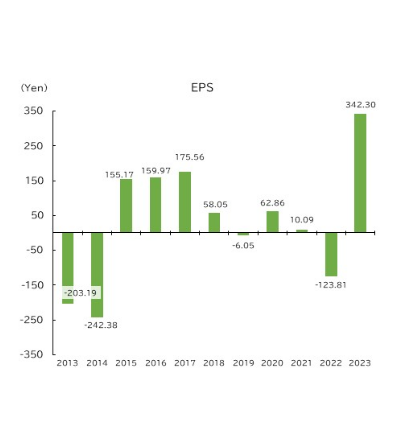
Note: EPS= net income concerning common stocks / average number of common stocks during FY
BPS
(Consolidated)

Note: BPS= equity concerning common stocks / total number of issued and outstanding common stocks as of the end of FY
PER
(Consolidated)

Note: PER= stock price as of the end of FY / net income per share
PBR
(Consolidated)
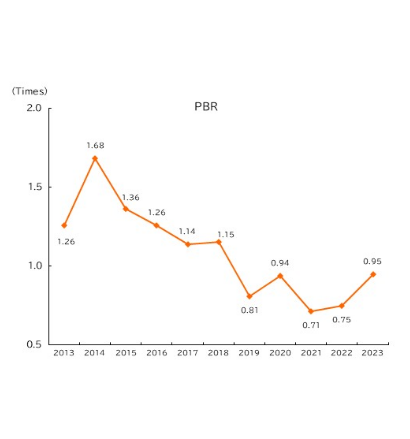
Note: PBR= stock price as of the end of FY / equity per share
PCFR
(Consolidated)
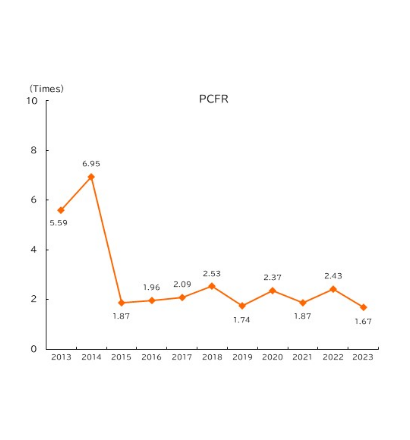
Note: PCFR= stock price as of the end of FY / cash flow per share
Our fiscal year starts April 1 and ends March 31.